Our partner Openlink recently published a new DBpedia usage report on the SPARQL endpoint and associated Linked Data deployment
Copyright © 2020 OpenLink Software
Introduction
Just recently, DBpedia Association member and hosting specialist, OpenLink released the DBpedia Usage report, a periodic report on the DBpedia SPARQL endpoint and associated Linked Data deployment.
The report not only gives some historical insight into DBpedia’s usage, number of visits and hits per day but especially shows statistics collected between July 2017 and September 2020, spanning more than 3 years of logs from the DBpedia web service operated by our partner OpenLink Software at http://dbpedia.org/sparql/.
Before we want to highlight a few aspects of DBpedia’s usage we would like to thank OpenLink for the continuous hosting of the DBpedia Endpoint and the creation of this report.
DBpedia Usage Report: Historical Overview
The first table shows the average numbers of Visits and Hits per day during the time each DBpedia dataset was live on the http://dbpedia.org/sparql endpoint. Similarly to the hits, we also see a huge increase in visits coinciding with the DBpedia 2015–10 release on April 1st, 2016.
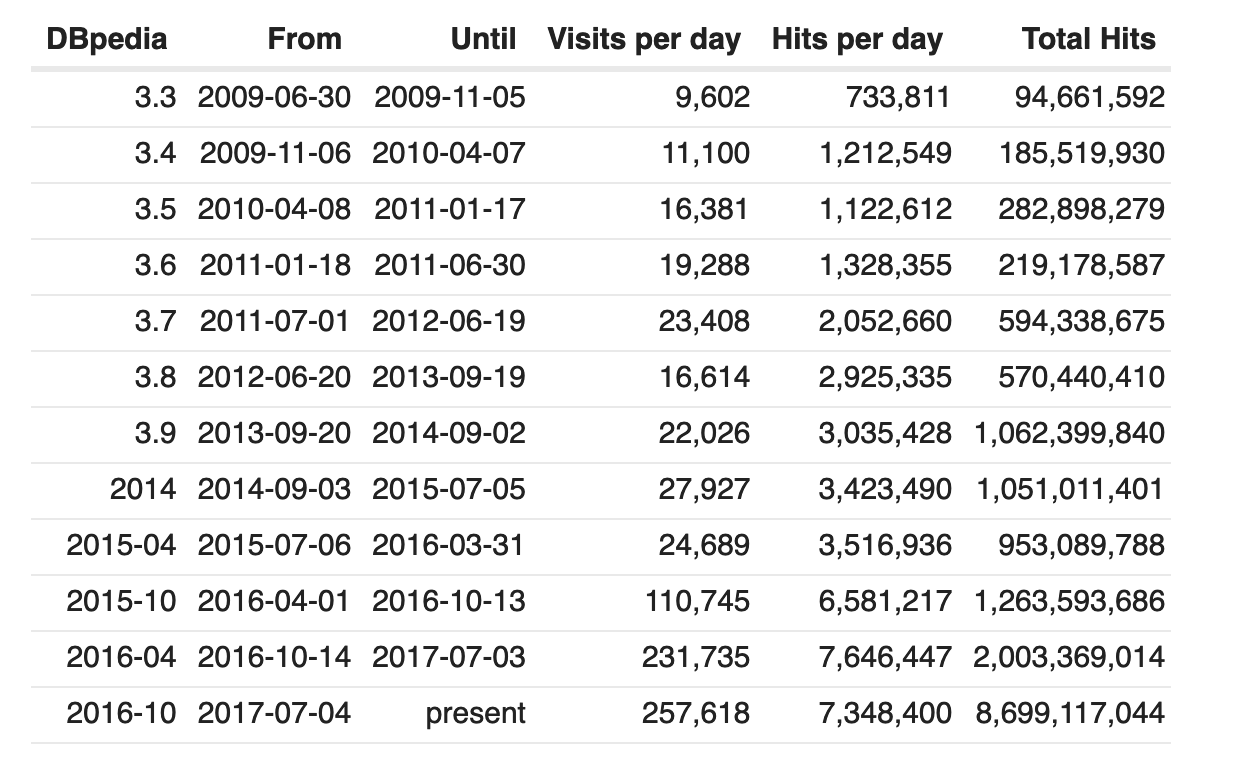
This boost was attributed to an intensive promotion of DBpedia via community meetings, and exchange with various partners in the Linked Data community. In addition, our Social Media activity in the community increased backlinks. Since then, not only the numbers of hits rose but DBpedia also provided for better data quality. We are constantly working on improving accessibility, data quality and stability of the SPARQL endpoint.
Kudos to Open Link for maintaining the technical baseline for DBpedia.
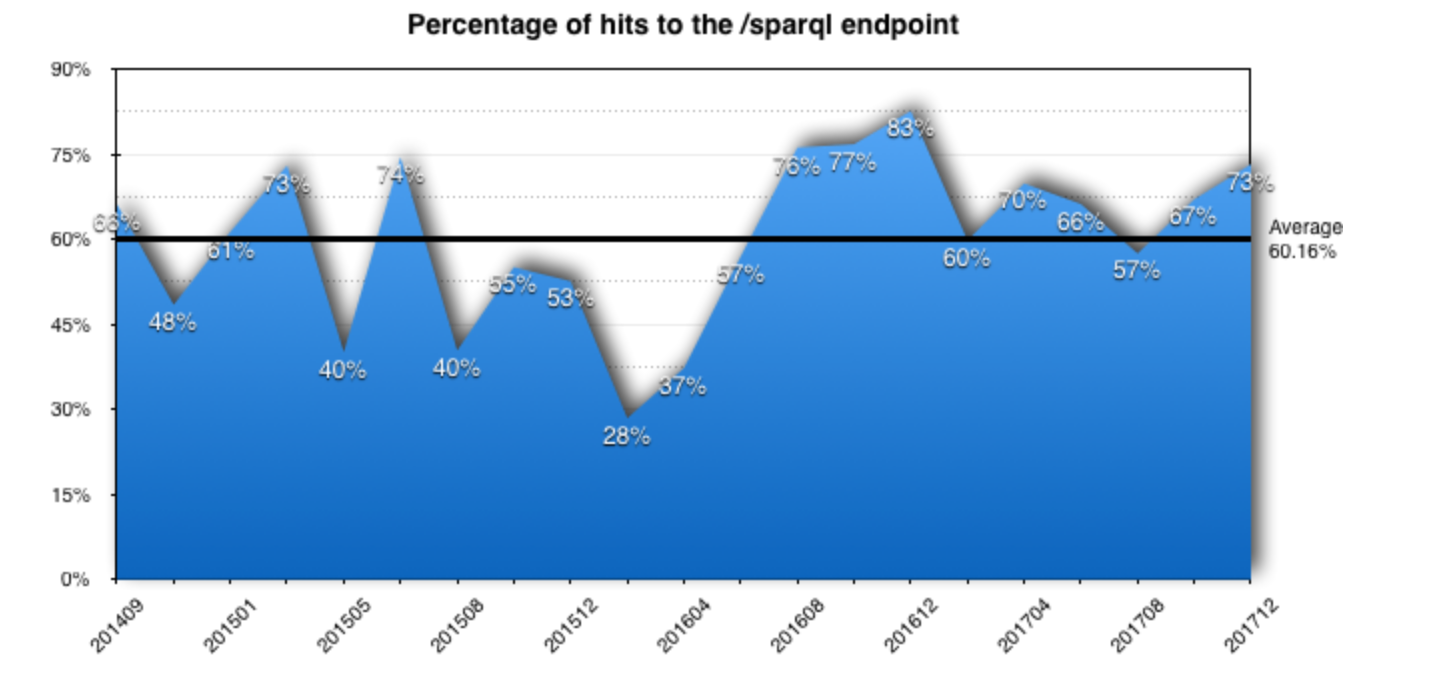
The next graph shows the percentage of the total number of hits in a given time period that can be attributed to the /sparql endpoint. If we look at the historical data from 2014–09 onward, we can see the requests to /sparql were about 60.16% of the total number of hits.
DBpedia Usage Report: Current Statistics
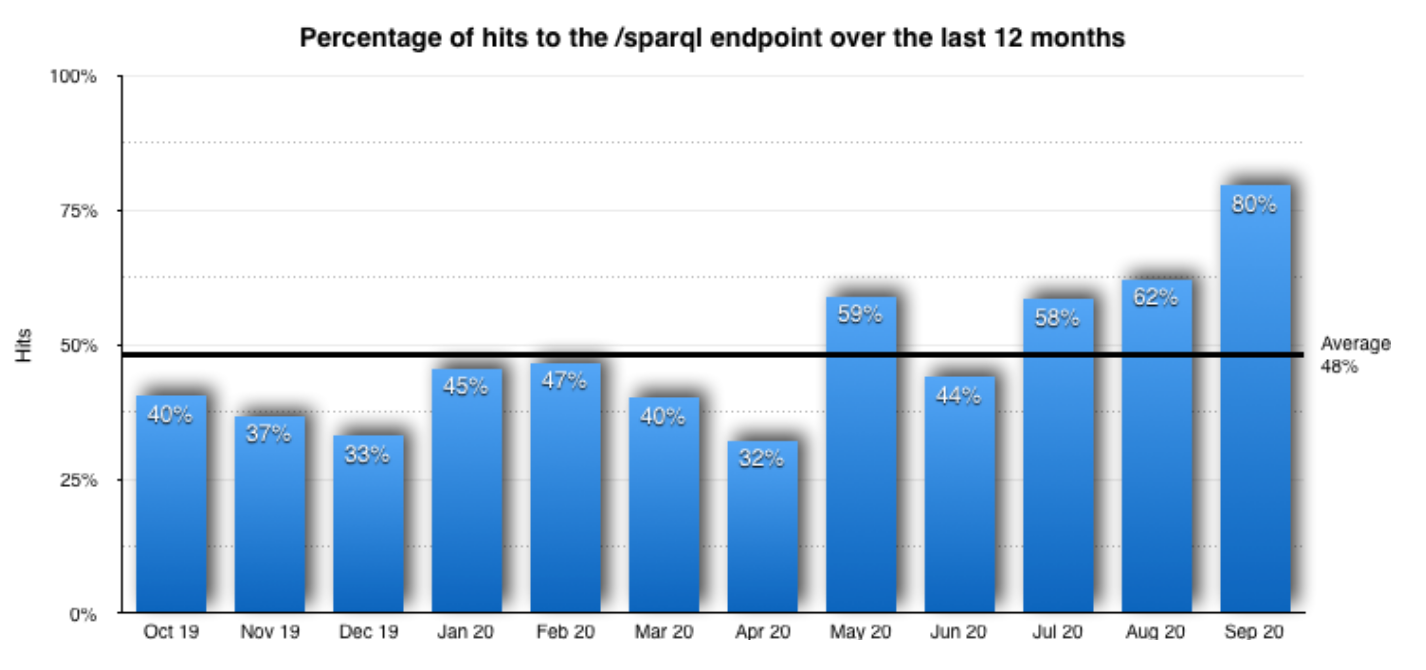
If we focus on the last 12 months, we can see a slightly lower average of 48.10%, as shown in the graph below. This means that around 50% of traffic uses Linked Data constructions to view the information available through DBpedia. To put this into perspective, that means that of the average of 7.2 million hits to the endpoint on a given day, 3.6 million hits are Linked Data Deployment hits.
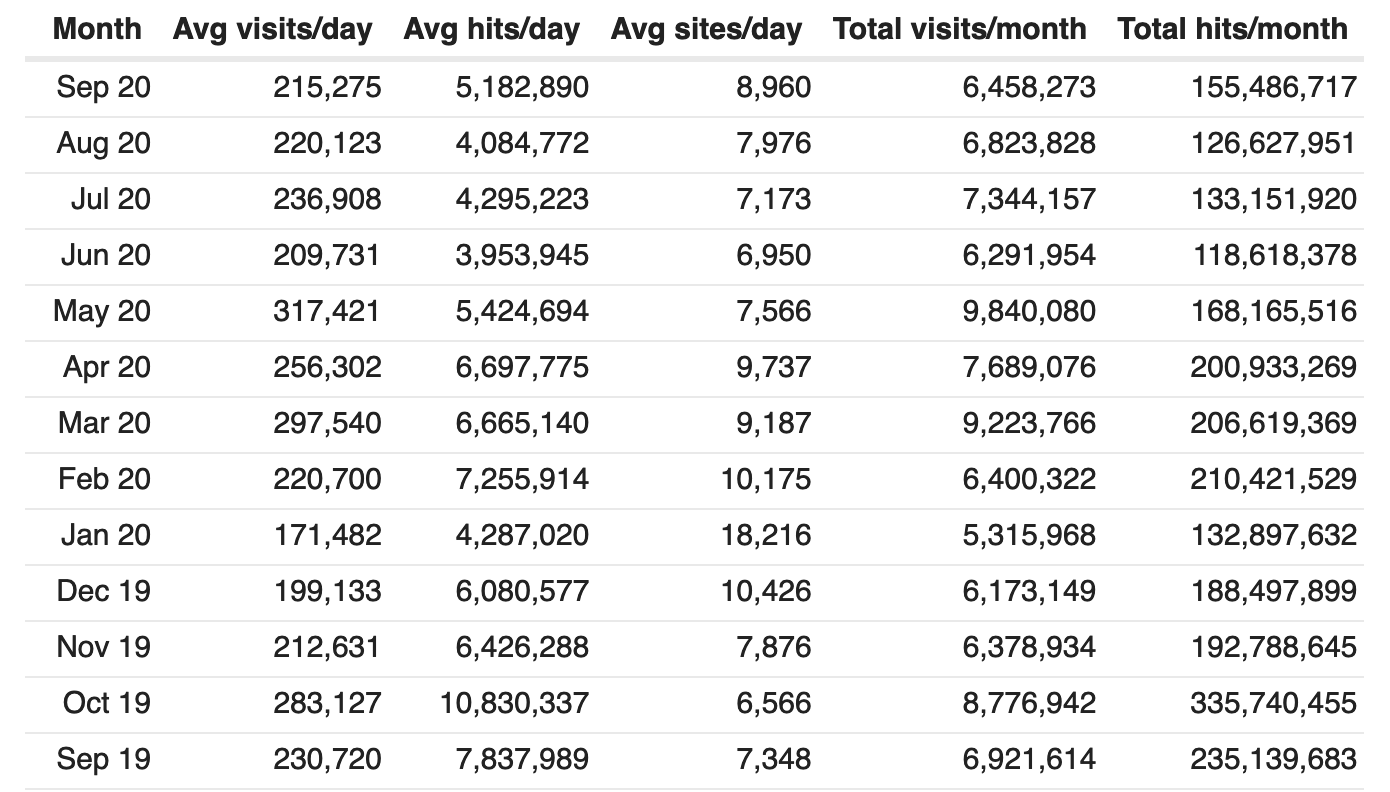
The following table shows the information on visits, sited and hits for
each month between September 2019 and 2020.
For detailed information on the specific usage numbers, please visit the original report by Openlink published here. Also, older reporst are available through their site.
Further Links
For the latest news, subscribe to the DBpedia Newsletter, check our DBpedia Website and follow us on Twitter, Facebook, and LinkedIn .
Thanks for reading and keep using DBpedia!
Yours DBpedia Associaton
- Did you consider this information as helpful?
- Yep!Not quite ...